

Week 1: Mapping Our Watershed
Students investigate why civilizations form near water by comparing ancient River Valley Civilizations with the Georgetown County and Lowcountry watershed. The week blends geography, natural resources, local history, decimal resource ledgers, estimation, place-value reasoning, visual synthesis, and evidence-based one-pager design.
Framework Mapping
ADTL Expression
Students begin with a lived design question: why do people build communities where they do? Ancient rivers and local waterways become visible systems that shape survival, settlement, trade, and power.
WICOR Expression
Students read maps and short source excerpts, organize geographic evidence, collaborate through share-outs and partner review, then write comparative summaries using precise spatial vocabulary.
Cognia Expression
The week uses active learning, local relevance, STEM integration, formative exit tickets, and student-produced maps to create visible evidence of growth across all five days.
Defining Civilizations and Geographic Anchors
Students examine the five core traits of a civilization: advanced cities, specialized workers, complex institutions, record keeping, and advanced technology. They then connect these traits to physical geography by studying major River Valley Civilizations near the Nile, Tigris and Euphrates, Indus, and Huang He rivers.
The central idea is that early humans did not settle randomly. Water, natural resources, floodplains, flat land, fertile soil, protection, and access to movement routes helped groups shift from survival-based movement to organized communities.
Early humans did not settle in places by accident. For thousands of years, many people lived as nomads who moved from place to place to find food, water, and shelter. Over time, some groups discovered that certain locations made survival easier. One of the most important locations was near a river because rivers provided dependable water and access to nearby resources.
Rivers gave people water for drinking, cooking, washing, farming, and caring for animals. Rivers also helped plants grow. When rivers flooded, they often left behind rich soil called silt. This made the land near rivers useful for farming. Farming allowed people to grow more food and stay in one place for longer periods of time.
As farming improved, communities became larger and more organized. Some people became farmers, while others became builders, toolmakers, traders, priests, government workers, or record keepers. This growth of specialized jobs helped communities develop the traits of a civilization: cities, workers with different roles, institutions, record keeping, and technology.
The earliest river valley civilizations developed in places such as Mesopotamia, Egypt/Kush, India, and China. These societies did not develop in exactly the same way, but they shared an important pattern: people used river systems and natural resources to farm, travel, trade, protect communities, and organize larger societies.
Developed near the Tigris and Euphrates Rivers, where irrigation and public works helped people manage unpredictable flooding.
Developed along the Nile River system, where water, fertile soil, and movement routes supported farming and settlement.
Developed near the Indus River system, where water access helped support settlement, farming, and trade.
Developed near the Huang He River Valley, where fertile land and flood risk shaped early communities.
Students compare the Nile River with the Tigris and Euphrates Rivers. The Nile flooded in a more predictable seasonal cycle, which helped people in Egypt/Kush plan agriculture and connect the river with order and stability.
In Mesopotamia, flooding could be more irregular and destructive. Students analyze how unpredictable geography could shape farming, public works, religious outlooks, and the way communities understood risk.
Early civilizations depended on rivers. Rivers provided fresh water, supported farming, helped people travel, and made trade easier. However, not every river shaped civilization in the same way. Some river systems created a sense of order and predictability, while others created both opportunity and risk.
The Nile River in Egypt and Kush flooded in a more predictable seasonal pattern. Each year, the river rose and spread water over nearby land. When the water went back down, it left behind rich soil that helped farmers grow crops. Because the flooding happened in a regular cycle, people could plan when to plant and harvest.
In Mesopotamia, the Tigris and Euphrates also provided water and fertile soil, but their flooding was less predictable. Floods could arrive suddenly, damage crops, destroy homes, or wash away important land. People responded by building irrigation canals, levees, dikes, and other public works.
The Nile and the Tigris and Euphrates both supported civilization, but they shaped society in different ways. The Nile supported agricultural planning and stability, while Mesopotamia's rivers required flexible responses to risk. Geography influenced not only where people lived, but also how they worked, worshiped, governed, and understood the world around them.
| Feature | Egypt/Kush | Mesopotamia |
|---|---|---|
| River System | Nile River | Tigris and Euphrates Rivers |
| Flood Pattern | Seasonal and more predictable | More irregular and sometimes destructive |
| Social Impact | Supported planning and stability | Required irrigation, labor organization, and public works |
Local Geography Connection: Lowcountry River Networks
Students connect ancient geography to their own region by examining the Sampit, Black, Waccamaw, and Great Pee Dee river networks. The lesson positions Georgetown County and Winyah Bay as a local case study for movement, food, cultivation, and settlement.
Students compare local waterways with the Nile, Mesopotamia, India's Indus River system, and China's Huang He River valley. The goal is to see how natural resources, transportation routes, and water access influence where communities grow.
Early civilizations often developed near rivers because people needed water, food, fertile soil, and transportation routes. The Nile River, the Tigris and Euphrates Rivers, the Indus River, and the Huang He River all helped people build larger communities. These river valleys supported farming, fishing, movement, trade, and the growth of cities.
The same type of geographic thinking can help us understand our own region. Georgetown County and the Lowcountry are shaped by water. The Sampit, Black, Waccamaw, and Great Pee Dee Rivers connect with Winyah Bay before reaching the Atlantic Ocean. This created a local river network where people could move, fish, farm, trade, and build communities.
Indigenous communities, including communities connected to the Waccamaw region, used local rivers, marshes, forests, and coastal waters as part of a survival system. Later, European settlers recognized that waterways could support movement, trade, farming, and settlement. African settlers and enslaved Africans also used deep agricultural knowledge to shape rice cultivation in wetland environments.
The local environment shows that geography is not just background information. Rivers and wetlands affected what people ate, how they traveled, where they settled, what they farmed, and what they traded. In both ancient river valleys and the Lowcountry, water helped people survive, build communities, and organize economic systems.
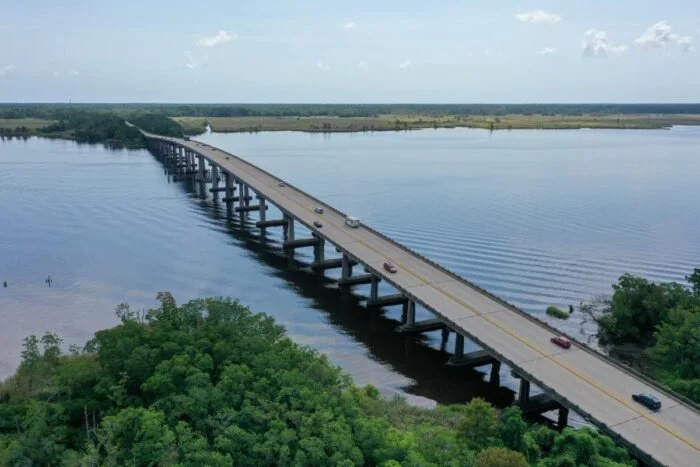
Waccamaw River
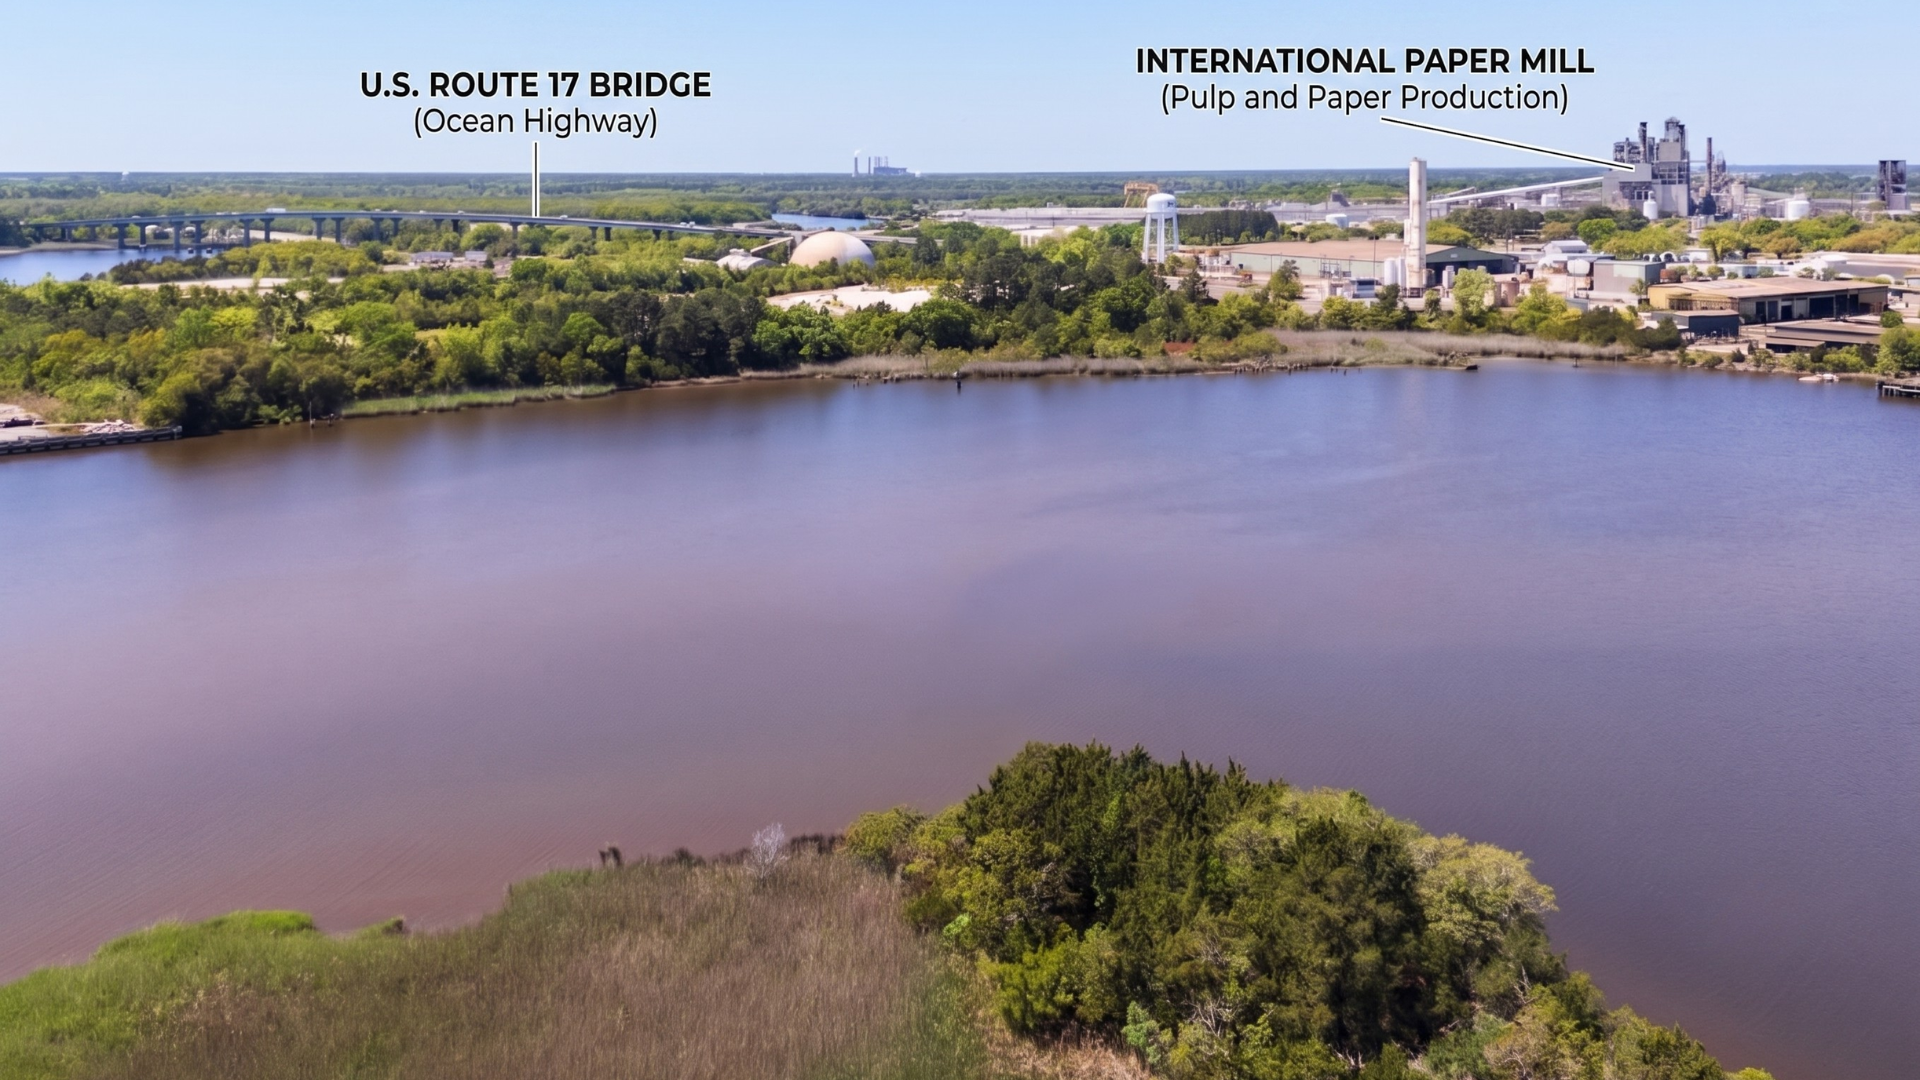
Sampit River
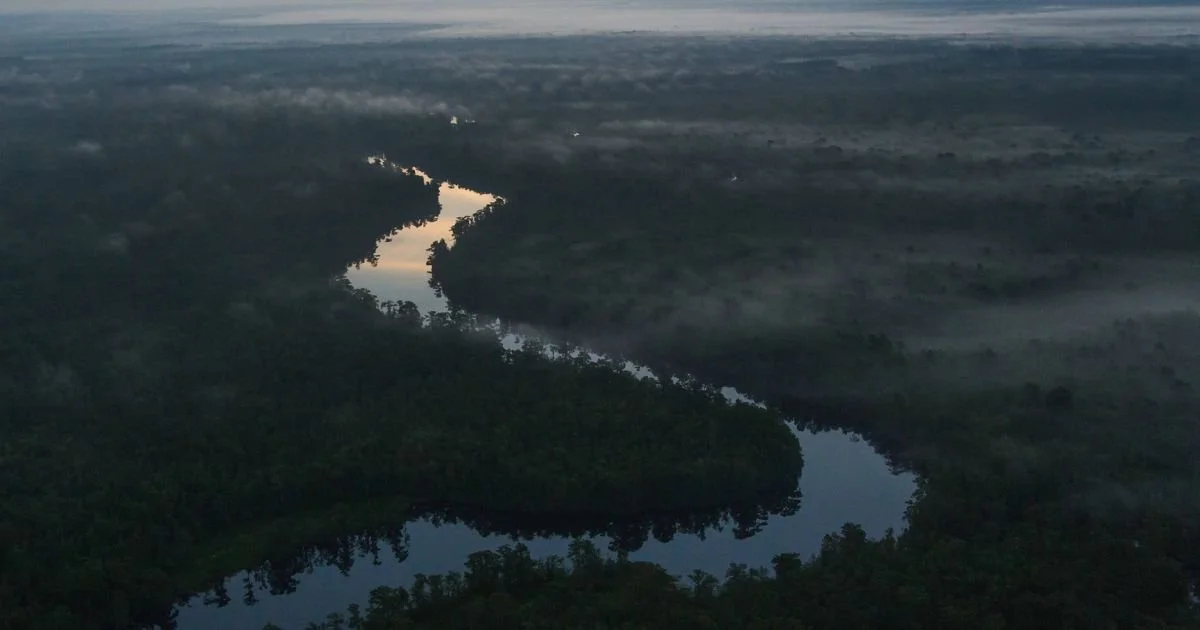
Black River
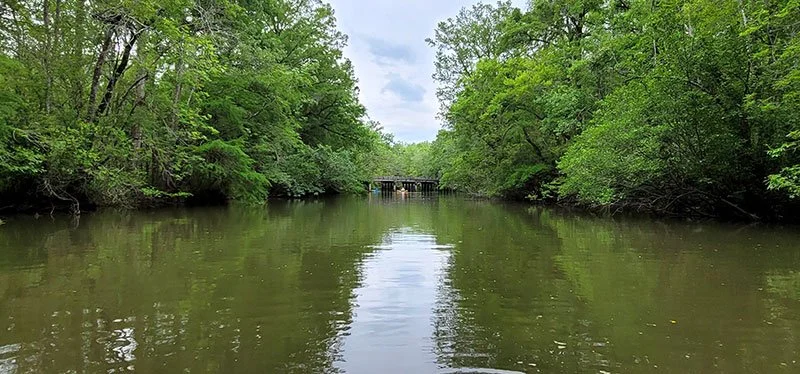
Great Pee Dee River
Sampit, Black, Waccamaw, Great Pee Dee
Transport, fishing, crop cultivation, protection, trade access
Project Day 1: River Valley Resource Ledger
Students use decimals to compare how river communities used water, food resources, trade routes, transportation, and labor. Instead of only describing geography, students organize evidence into a resource ledger that turns qualitative page evidence into classroom-model decimal scores.
The Day 04 data sets come from two ancient river valley civilizations and four local Lowcountry rivers already described on this page: Mesopotamia, the Nile River Valley, the Waccamaw River, the Sampit River, the Black River, and the Great Pee Dee River.
Students estimate, add, and subtract decimal values to compare one ancient river community with one local river community. They use the final numbers to make a historical claim about how rivers supported farming, food resources, trade, movement, labor, settlement, or community growth.
Historians often compare civilizations by looking at evidence. Evidence can include maps, artifacts, written records, or numerical data. In this project, students use numbers to compare how people used river environments. A decimal ledger helps students organize data about food, labor, trade, transportation, and resource access.
The decimal values below are classroom-model evidence scores from 0.0 to 10.0. They are not exact historical measurements. They are generated from information already on this page so students can practice using decimals as evidence. A higher score means the page gives stronger evidence that the river supported that category.
The Nile River Valley receives high scores for food resources and water stability because the page explains that predictable flooding helped farmers plan agriculture. Mesopotamia receives a high labor and public works score because the page explains that irregular flooding required irrigation, canals, levees, and organized labor.
The local river scores come from the Day 03 river cards. Waccamaw connects to Indigenous fishing, rice cultivation, timber, port activity, and recreation. Sampit connects to fishing, Georgetown harbor trade, industry, tourism, and waterfront use. Black River connects to hunting, fishing, rice and indigo, timber, conservation, and recreation. Great Pee Dee connects to Indigenous trade routes, cash crop transport, timber movement, conservation, and current recreation.
| Data Set | River Community | Evidence Used From This Page | Food / Farming Resources | Trade / Movement | Water Access / Stability | Labor / Public Works | Total |
|---|---|---|---|---|---|---|---|
| A | Nile River Valley | Predictable flooding, fertile soil, farming stability, travel, and trade. | 9.6 | 8.4 | 9.8 | 6.2 | 34.0 |
| B | Mesopotamia | Irrigation, grain, canal labor, public works, flood risk, and risk management. | 8.7 | 8.1 | 6.5 | 9.4 | 32.7 |
| C | Waccamaw River | Fishing, hunting, rice cultivation, timber transport, Winyah Bay access, recreation, and ecology. | 8.8 | 8.6 | 9.1 | 8.3 | 34.8 |
| D | Sampit River | Fishing grounds, sheltered route to Winyah Bay, Georgetown harbor, colonial trade, industry, and tourism. | 7.9 | 9.4 | 8.7 | 8.9 | 34.9 |
| E | Black River | Hunting, fishing, blackwater navigation, rice and indigo plantations, timber, conservation, and recreation. | 8.5 | 6.8 | 8.2 | 7.2 | 30.7 |
| F | Great Pee Dee River | Indigenous trade corridor, cash crop transport, steamboats, timber movement, conservation, and recreation. | 8.9 | 9.2 | 9.0 | 8.5 | 35.6 |
Food / Farming Resources
Shows how strongly the river supported farming, fishing, shellfish, grain, rice, or other food systems.
Trade / Movement
Shows how strongly the river supported transportation, exchange, port activity, or movement of people and goods.
Water Access / Stability
Shows how useful or dependable the river system was for settlement, travel, planning, or survival.
Labor / Public Works
Shows how much work, planning, irrigation, rice cultivation, industry, or river management the evidence suggests.
Project Day 2: River Valley One-Pager, Visualizing Similarities and Differences
Students use the Day 04 decimal ledger as evidence, but Day 05 shifts the work from calculation to visual communication. Students create a one-pager that illustrates how one ancient river community and one local river community are similar and different.
The one-pager should show how rivers shaped food and farming, trade and movement, water access and stability, and labor or public works. Students should translate the data set totals, category scores, and historical evidence into symbols, colors, captions, arrows, sketches, and short written claims.
The goal is not decoration. The goal is visual historical analysis. Students use design choices to explain how water helped people survive, settle, farm, travel, trade, organize labor, and build communities across different times and places.
A one-pager is a visual explanation of an idea. In this lesson, students use one page to show what their Day 04 decimal evidence means. Instead of writing only a paragraph, students arrange images, words, numbers, arrows, symbols, and color choices to make a clear comparison.
A strong one-pager includes both an ancient river community and a local river community. For example, a student might compare Mesopotamia with the Sampit River, or the Nile River Valley with the Great Pee Dee River. The page should show what both communities had in common and what made them different.
Students should use the four Day 04 evidence categories as the structure of the design: food and farming resources, trade and movement, water access and stability, and labor or public works. Each category should appear somewhere on the one-pager through a label, symbol, drawing, data value, or short caption.
The finished one-pager should make a claim. A claim might explain that both communities depended on rivers for survival and movement, but one river system required more labor while another became more important for trade. The artwork, evidence, and written details should all support that claim.
Create a large symbol that connects both communities, such as two rivers flowing together, a split map, a bridge, a watershed, or a compass.
Place the ancient river community on one side and the local river community on the other side so viewers can compare them quickly.
Add at least two decimal values from Day 04 and explain what those numbers show about resources, movement, stability, or labor.
Write one clear claim sentence that explains how rivers shaped settlement, survival, farming, transportation, trade, or public works.
Use color with purpose. Blue can represent water access and stability, green can represent food or farming, gold can represent trade and movement, and gray can represent labor or public works. Students may choose different colors, but they must explain what the colors mean.
| One-Pager Area | What Students Should Show | Why It Matters |
|---|---|---|
| Top | Title and chosen river communities | Identifies the comparison clearly. |
| Center | Large symbolic image | Shows the big idea visually. |
| Left / Right | Ancient example and local example | Organizes similarities and differences. |
| Edges or Corners | Vocabulary, decimal values, category labels, captions, arrows, and symbols | Turns Day 04 evidence into visual analysis. |
| Bottom | Final claim sentence | Explains what the comparison proves. |
Weekly Product: Mapping Our Watershed
By the end of the week, students should submit two connected products: a completed Day 04 decimal resource ledger and a Day 05 River Valley One-Pager. The ledger shows the evidence values, estimates, sums, and differences. The one-pager shows what those numbers mean through visual historical analysis.
The one-pager should compare one ancient river community with one local Lowcountry river community. Strong products connect civilization, River Valley Civilizations, natural resources, water, fertile land, transportation, labor, trade, and resource access to the development of communities.
Students should use images, symbols, arrows, color, vocabulary, decimal evidence, and short written explanations to show at least two similarities and two differences. The final product should make a clear claim about why people repeatedly used rivers and waterways for survival, farming, transportation, labor, trade, or settlement.
Updated: -
- -
| Item | Type | Qty | Cost | Status | Fulfilled |
|---|---|---|---|---|---|
| No purchases yet. | |||||